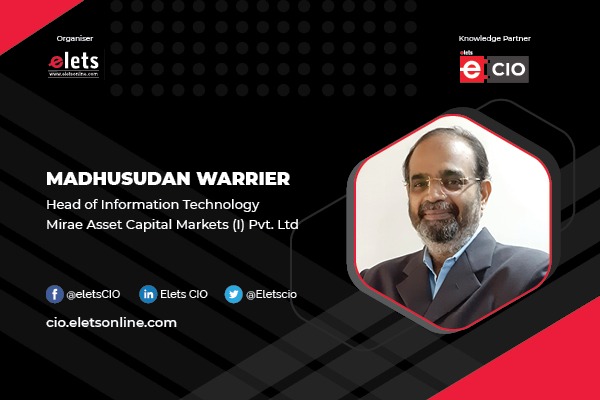
The industry is redefining revenue growth by leveraging digital technologies and analytics to access next-generation commercial levers. Nidhi Shail Kujur of Elets News Network(ENN) interacted with Madhusudan Warrier, Head – of Information Technology, Mirae Asset Capital Markets (I) Pvt. Ltd about how technology has helped in the exponential rise in revenue generation and what should be the way forward to further increase it.
What innovations are you planning to implement in the company?

We hope to make our platform strong and offer products and services that our customers want. Having said this, we are exploring options that can allow our customers to trade through Social Media Platforms like Whatsapp and SMS. We are building up a data warehouse which will eventually be used to customize and give insights into customer behaviour. The models we build around the data will help predict likely customer actions in each scenario. Apart from this, we are also evaluating an integrated testing mechanism that will help in checking the critical parameters in our Web and App offerings for our ongoing testing and new features.

We are exploring a Robo-advisory service that can be an automated financial planner. The plan is to make an algorithm that combines savings capacity and investment goals to create possible investment options that one can choose from.

What will be the right choice of mutual funds, split between equity and fixed income? It can also include suggestions on investing directly in stocks, fixed deposits, insurance, pension plans and gold. As a distributor of these products, it earns a commission on every sale that it makes.
Our focus remains to give a single platform that our customers can use for their investments. Watch out for the messages from our Management, on some different products that will excite you.
Technologies are the driver of the 21st-century world and they have transformed every facet of governance and administration. But they are also prone to various cyber-attacks. Could you list out some of the ways to address this challenge?
As long as, there is innovation and change, there is bound to be a vulnerability that is waiting to get exploited. We need to always be vigilant and on the lookout for misleading emails and compromised web pages (spam and phishing). Interacting with these puts your information at risk and can download viruses. Remember:
- We should not open emails from unknown email addresses.
- Check for the attachments in unexpected emails.
- Think before we act on Click Here messages in emails. A better practice is to type the address into your browser.If your mobile device is compromised or lost or stolen, it could be used to access information, and steal identity and data like photos or messages. Secure devices by:
- Installing reputed anti-virus software
- Set a password, gesture or fingerprint that must be entered to unlock your device
- Setting the device to require a password before applications are installed
- Leave Bluetooth hidden when not in use and disable automatic connection to networks
- Enable remote locking and/or wiping functions if the device supports them
- Have a robust mechanism to back up data and source code.
Also Read | Businesses in India are planning major investments in digital technologies
Corporates build controls to prevent cyber attacks by :
– Developing and implementing cyber security policies
– Implementing security awareness training
– Installing spam filters and anti-malware software
– Deploying Next-Generation Firewalls (NGFW)
– Installing endpoint detection & response (EDR)
Where there are mature information security processes, corporates look at strengthening and improving the standards for
– Performing deeper vulnerability assessments and penetration testing
– Tightly integrate AI tools with security information and event management (SIEM)
– Build and review controls on intrusion detection & prevention software (IDS and IPS)
– Review the data loss prevention (DLP) program
Apart from bringing efficiency, transparency and changing the entire gamut of governance, technology has helped in the exponential rise in revenue generation. What should be the way forward to further increase the revenue number?
If we observe, a hybrid model has become a new norm in the post-pandemic world. Just like employees prefer or demand flexible hybrid work opportunities, data indicates more than 80% of consumers are choosing to make purchases through hybrid sales channels. Virtual selling options have focused their potential to cut down costs, open new sales channels and reach new audiences. A Gartner report that I was reading indicated that organizations have updated their sales team skills profile to adapt to modern sales, and a large percentage of corporates have begun investing in new technologies. With the right infrastructure enabled, revenue generation can be increased through virtual rooms that create opportunities for buyer-seller collaborations, give analytics and insights about customer needs, behaviour, and patterns and ultimately streamline and conclude virtual sales journeys—accelerating the pathway to deal closure.
In today’s world, change is being driven by the customer. Our customers expect relevant content about what they’re doing anytime, anywhere and in the format and on the device medium they choose. It’s the journey that dictates our strategy. So then there is a focus to keep up with this new kind of “always-connected” customer. How do we do this – the organizations that have embraced technology can deliver an unmatched customer experience. We have seen how the hospitality industry has changed. We have doctors consulting and diagnosing online. What is heartening to see, is that based on their geo-location and chips data we can send assistance to the needy. Fortunately, putting the customer first is already a focus of many organizations’ strategies. Research data indicates that 35% of business executives claim that digital transformation helps them meet better customer expectations and improve operational efficiency (40%), and 38% of executives plan to invest more in technology to make it their competitive advantage.
The companies that do transform digitally are creating highly engaged customers. And these customers are:
- Six times more likely to try a new product or service from their preferred brand (MACM has a website and App to promote its products)
- Four times more likely to have referred your brand to their friends, family and connections (MACM has a Refer and Earn offer, Health platforms like Goqii also promote
- Refer and Earn aggressively)
- Two times more likely to purchase with their preferred brand, even when a competitor has a better product or price
- Furthermore, highly engaged customers buy 90% more frequently, spend 60% more per purchase, and have 3x the annual value (compared to the average customer).
Also Read | “Developing the skills of internal people for adopting new technologies is the key to success”
Service being intangible and invisible good is not easy in calculating its exact number. It involves detailed complexities and intricacies to arrive at the actual figure. Could there be better ways to measure the IT service?
IT Service – Measure -> Tracking IT Service metrics is crucial as it helps to know if the approach and process are on the right path. In my view, we can measure the effectiveness of IT service through the following metrics –
Cost per ticket – Cost per ticket is the best indicator of efficiency in service and support. It is calculated by dividing the total monthly operating expense of a service desk or desktop support group by the monthly ticket volume. Operating expense includes the following components:
- Salaries and benefits for support technicians
- Salaries and benefits for indirect personnel (team leads, supervisors, workforce schedulers, dispatchers, quality assurance and quality control personnel, trainers, and managers)
- Technology and telecom expenses (computers, software licensing fees, automatic call distributor and voice response costs, telecom headsets and handsets, etc.)
- Facilities expense (office space, utilities, insurance, etc.)
- Travel, training, and office supplies
Customer Satisfaction Score (CSAT) – The average satisfaction score is tracked by CAST. An automated survey, asks customers to rate a specific experience from “very satisfied” to “not satisfied at all.” This metric is best for gathering up-to-date data as it is fast to calculate.
Customer Service Satisfaction (CSS) – CSS is used to measure how satisfied IT users are after a ticket is closed. Measuring CSS is through asking for feedback after every interaction they have. The data can be collected through forms, pop-ups, live chats, and online surveys. CSS will help learn about users’ frequently asked questions and problems.
Technician utilization – Average Resolution Time – This metric tracks the time it takes to reach a final resolution to a customer service issue. To calculate the average resolution time, you can divide the total number of cases resolved during a period under analysis by the total number of times to resolution. In other words, ART is the average time between a customer’s call for an objection and the time it is marked as “resolved”.
Also Read | Digital transformation and automation are driving the manufacturing industry
First-level resolution – First-level resolution refers to measuring the percentage of tickets resolved on first contact with the customer. There is a strong correlation between first-contact resolution and customer satisfaction. The CS is high when the service is resolved in the first contact. Similarly, Mean time to resolve (MTTR) is a service-level metric that measures the average elapsed time from when a ticket is opened to when it is closed. It is typically measured in business hours, not clock hours. A ticket that is opened at 4:00 pm on a Friday and closed out at 4:00 pm the following Monday, for example, will have a resolution time of eight business hours, not 72 clock hours. Most IT service management systems can easily measure and track MTTR. This also drives customer satisfaction, but the cause-and-effect relationship is not as strong as with first-contact resolution.
Technician job satisfaction – Progressive support organizations, therefore, measure technician job satisfaction at least twice annually and take steps to ensure that they are maintaining high levels of job satisfaction, and hence high morale in the workplace.
Balanced score
Net Promoter Score (NPS) – this indicates the willingness with which the Technology that we have offered our customers, are they willing to recommend the same to others. In MACM we have a Refer and Earn proposition which attempts to check ” How likely is it that our existing customer would recommend our product or service to their friends and family?”. The responses that we get would be between 0 and 10. We can subtract the percentage of detractors from the percentage of promoters.
Customer Effort Score (CES) – A customer effort score is used to measure how much effort a customer needs to exert to get a problem solved. Some examples of interactions are filling out an online form, looking for a product, or dealing with a technical difficulty. This metric is mainly used to help customers experience improvement by showing places where it’s possible to make improvements and make things easier for customers. The data is typically acquired through an automated survey where you ask the customer to specify the level of effort required to complete an activity.
Referral Rate – while NPS tracks how willing your customers are to suggest your business to their family and friends, referral rate measures if your customers do it. Referral rates can be measured in different ways. You can use a specially designed referral program with unique links for customers individually or use social listening to follow referral conversations.
Average Resolution Time – This metric tracks the time it takes to reach a final resolution to a customer service issue. To calculate the average resolution time, you can divide the total number of cases resolved during a period under analysis by the total number of times to resolution. In other words, ART is the average time between a customer’s call for an objection and the time it is marked as “resolved”.
Be a part of Elets Collaborative Initiatives. Join Us for Upcoming Events and explore business opportunities. Like us on Facebook , connect with us on LinkedIn and follow us on Twitter.
"Exciting news! Elets technomedia is now on WhatsApp Channels Subscribe today by clicking the link and stay updated with the latest insights!" Click here!


